Prometheus exporter service description
The Prometheus exporter is a service that collects metrics and transfers them to your Prometheus server for further visualization. Additionally, you can use it to check and analyze the metrics. *but don't overcomplicate things, try Grafana instead :)
The Prometheus exporter collects the following metrics:
- Total number of services
- Total number of servers
- Total number of servers marked as "Enabled" in the Servers section
- Total number of virtual servers
- Total number of users
- Total number of users categorized by roles
- Number of running Checker services for each HAProxy, NGINX, Keepalived, and Apache service
- Total number of running Checker services
- Statuses of Apache, NGINX, Keepalived, and HAProxy services
- Number of alerts per server categorized by type
- Total number of alerts categorized by type
- Number of running Auto start services for each HAProxy, NGINX, Keepalived, and Apache service
- Total number of running Auto start services
- Number of running Metrics services for each HAProxy, NGINX, and Apache service
- Total number of running Metrics services
Installation
1. Run the following commands to install the Prometheus exporter service:
2. Add the following text to the Prometheus configuration file
3. Reload your Prometheus server.
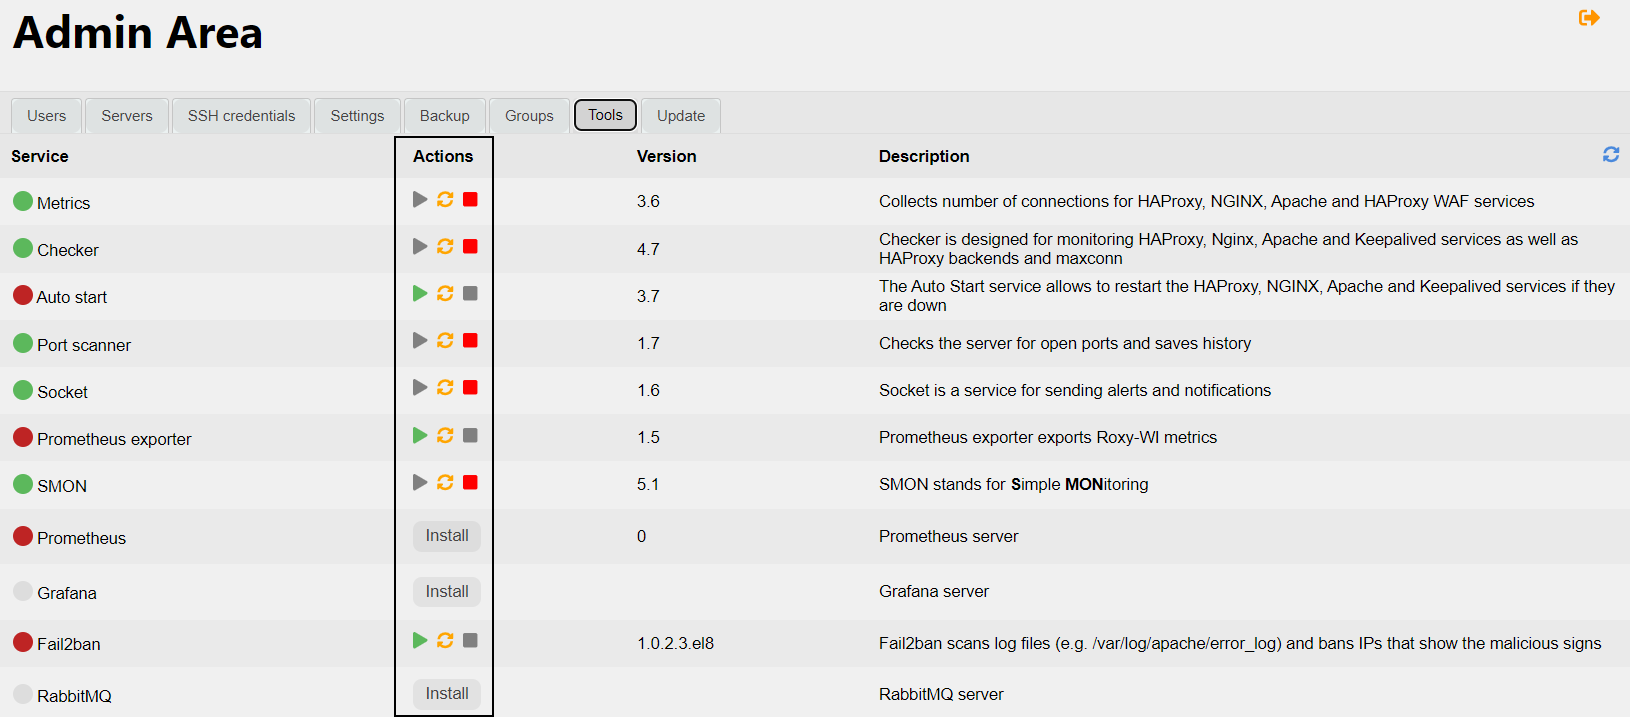
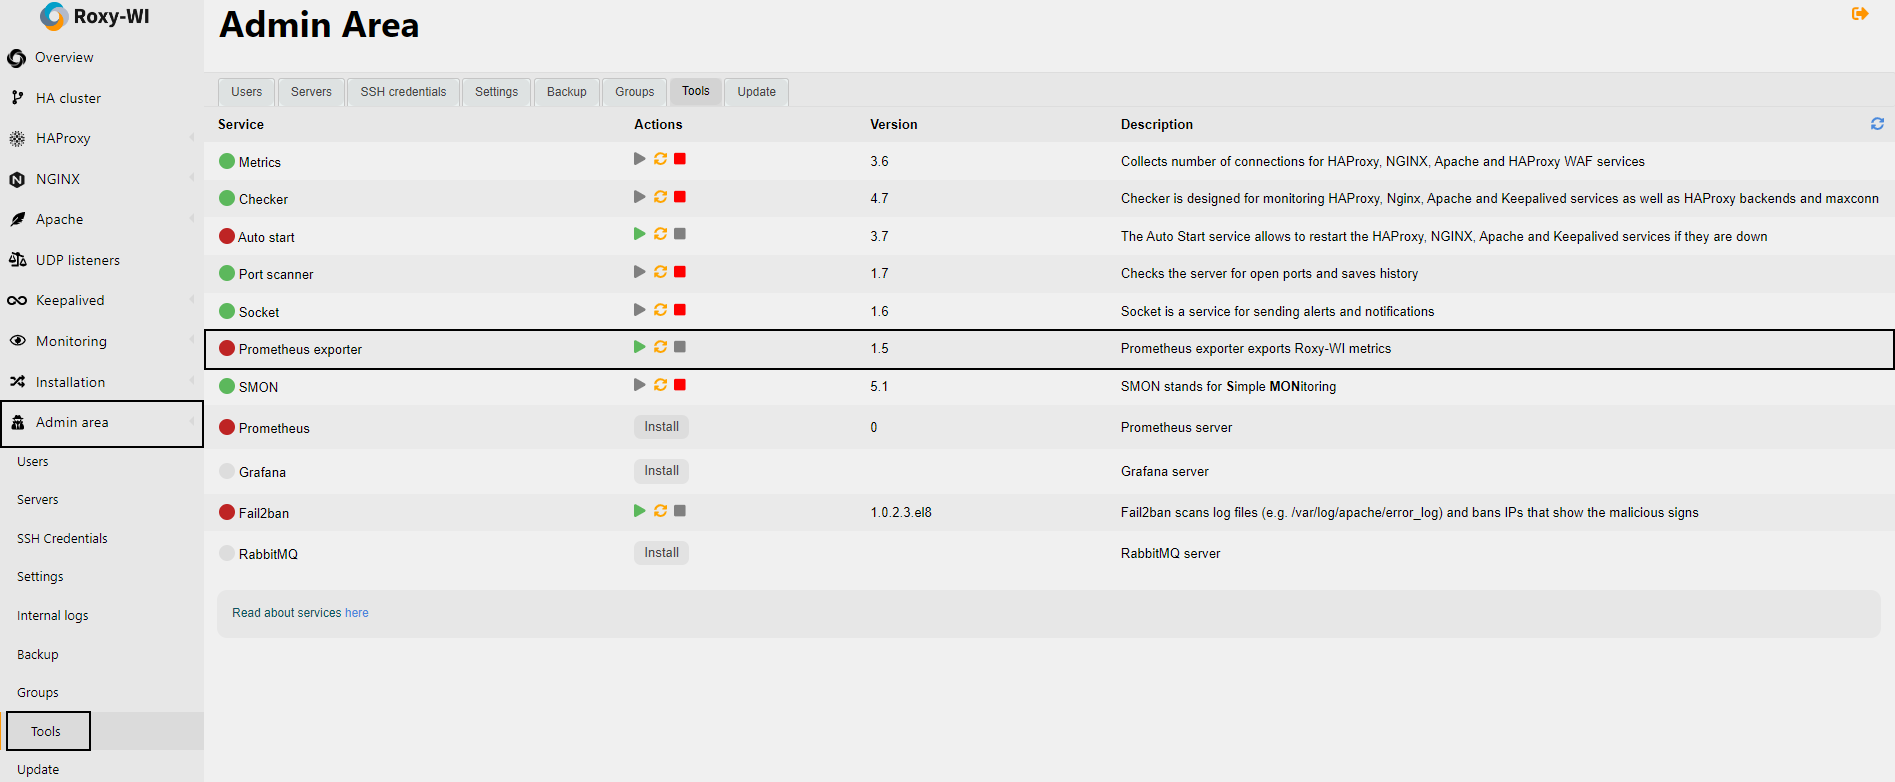
Service management
You can start, stop, and restart services in the Admin area => Tools section. To do this, click the corresponding button next to the desired service.
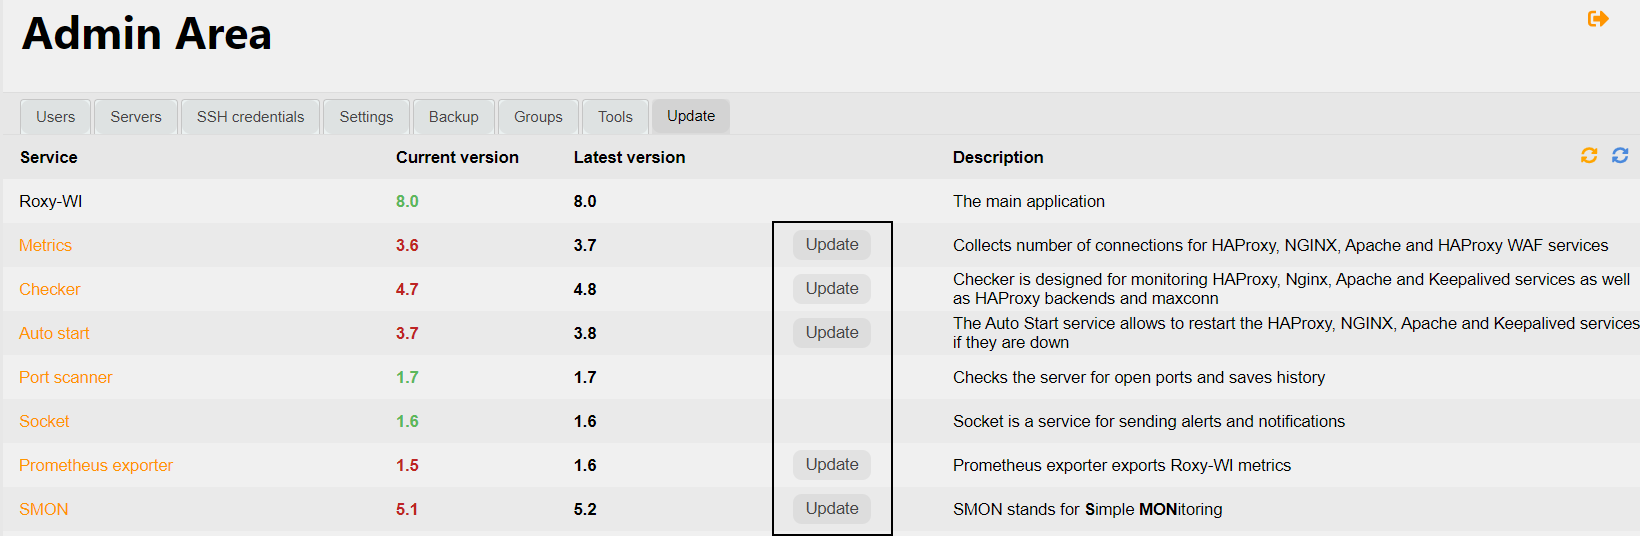
To update services, go to the Admin area => Update section and click Update next to the desired service.
A ready-made Grafana dashboard is available here for your service.
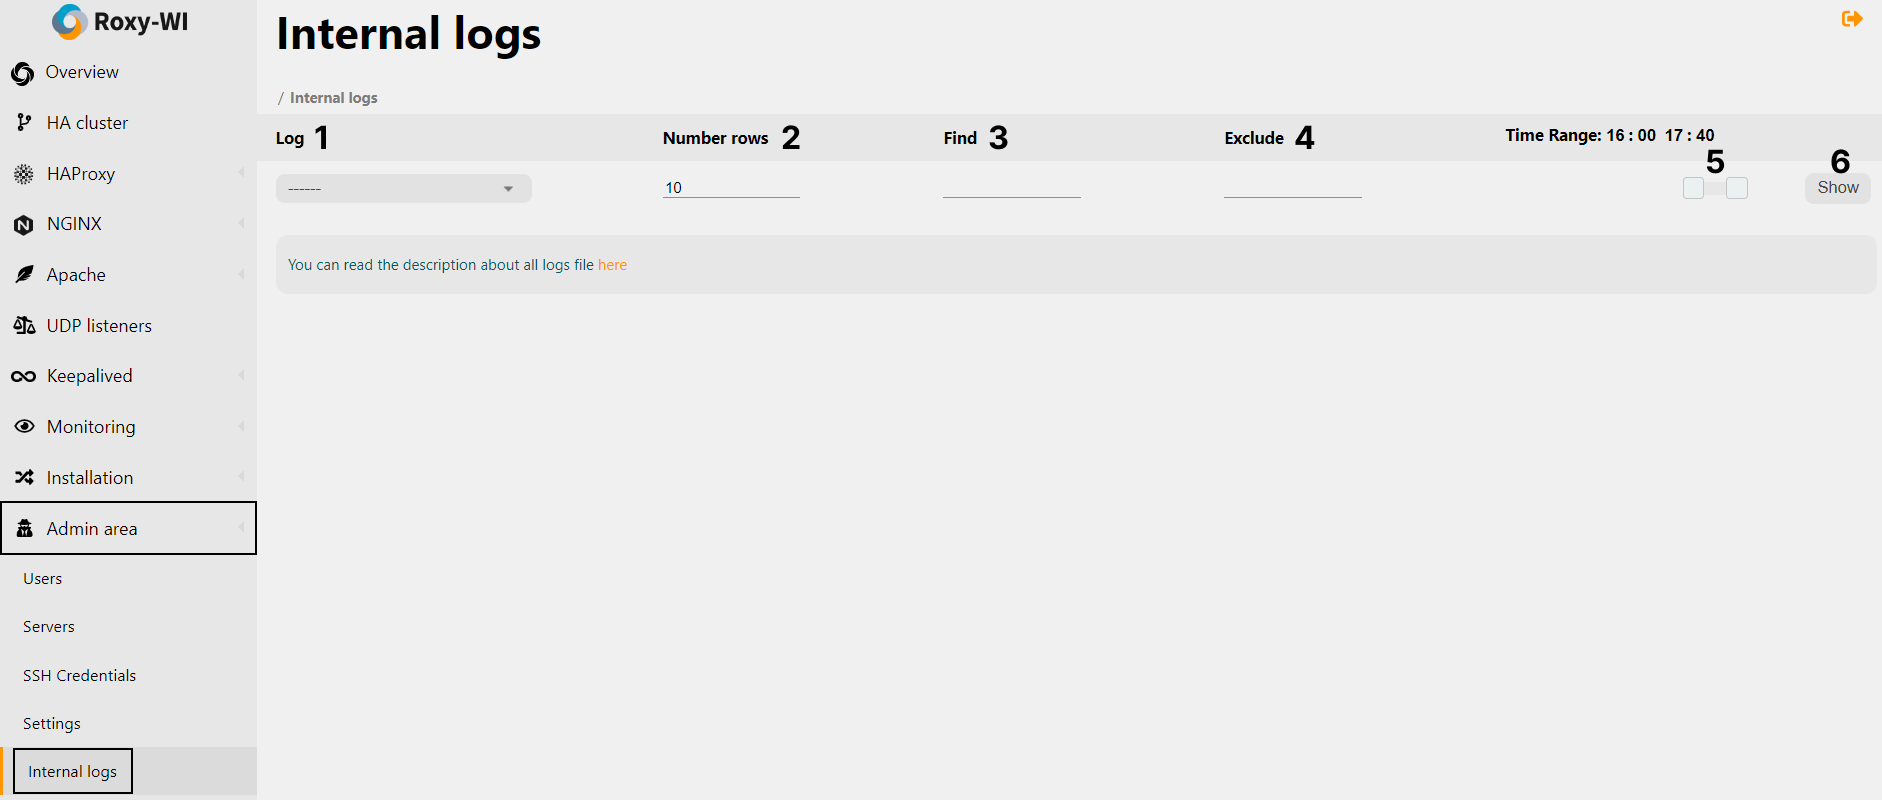
You can find logs for the Prometheus exporter in the Admin area => Internal logs section.
To view logs:
- Select the desired log from the drop-down list
- (Optional) Select the number of rows to display
- (Optional) Specify the information you want to find in the logs (regular expressions are supported)
- (Optional) Specify the information you want to exclude from the logs (regular expressions are supported)
- Select the time period for viewing logs by moving the slider
- Click Show
For more information about Internal logs, click here.