About Grafana and Prometheus servers
Grafana is a multi-platform open source analytics and interactive visualization software available since 2014. It provides charts, graphs and alerts for the web when connected to supported data sources. Moreover, different plug-ins are available. It's a good tool for end users to create complex monitoring dashboards using interactive query builder.
Prometheus is a free software application for event monitoring and real-time alerting. It collects real-time metrics in a time series database built using the HTTP pull model with flexible queries.
Architecture
A typical monitoring platform with Prometheus is composed of multiple tools:
- Multiple exporters that typically run on the monitored host to export local metrics;
- Prometheus to centralize and store the metrics;
- Alertmanager to trigger alerts based on those metrics;
- Grafana to create and manage dashboards;
- PromQL is the query language used to create dashboards and alerts.
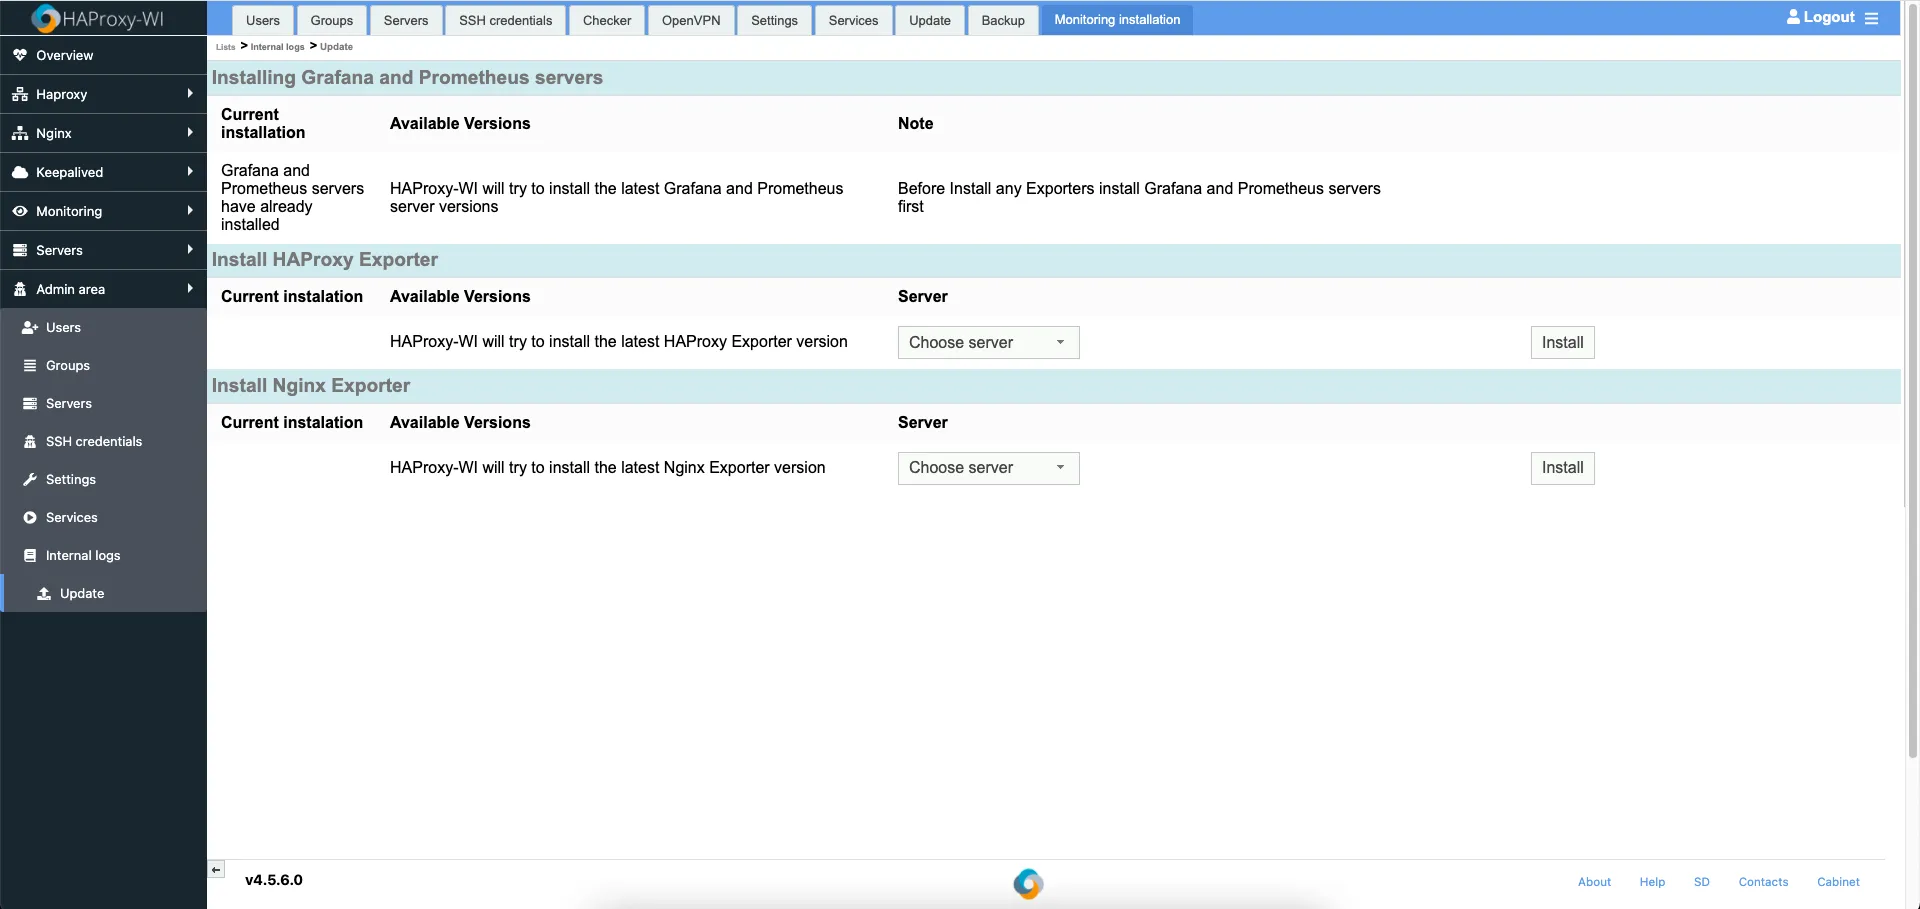
Roxy-WI allows installing Grafana and Prometheus via web interface. These services will be installed on the same server as Roxy-WI, so you may need more disk space for Prometheus database.
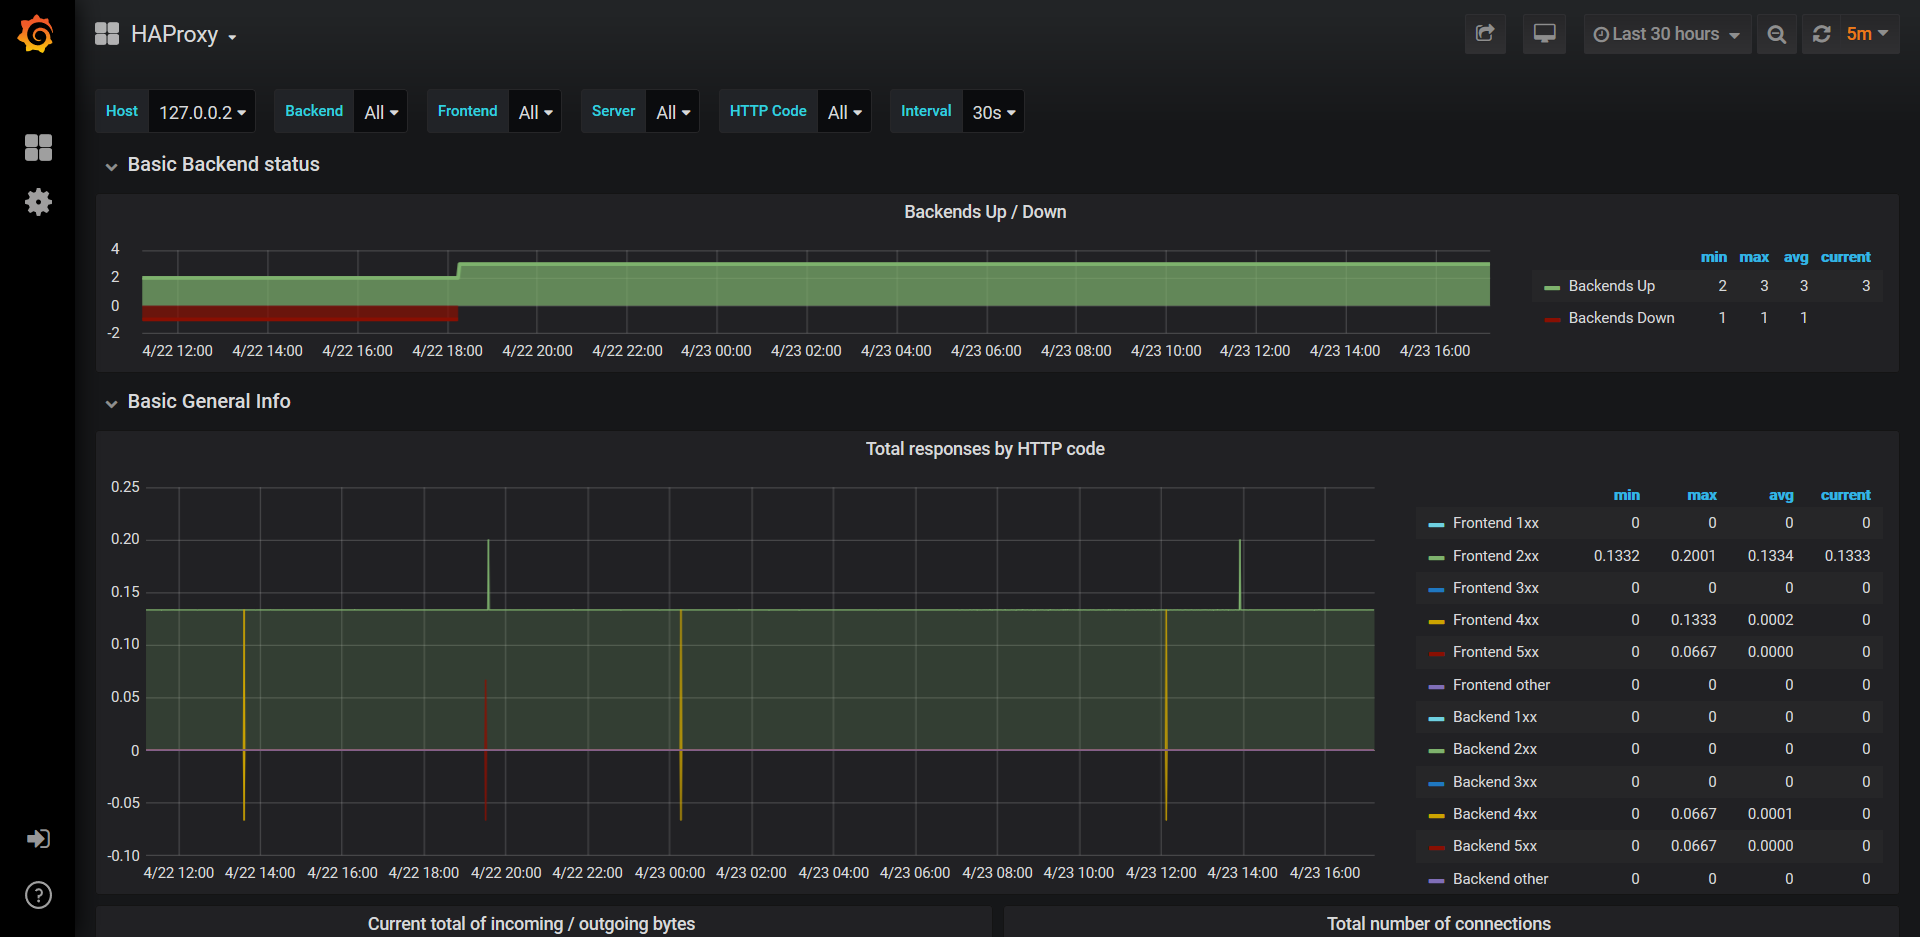
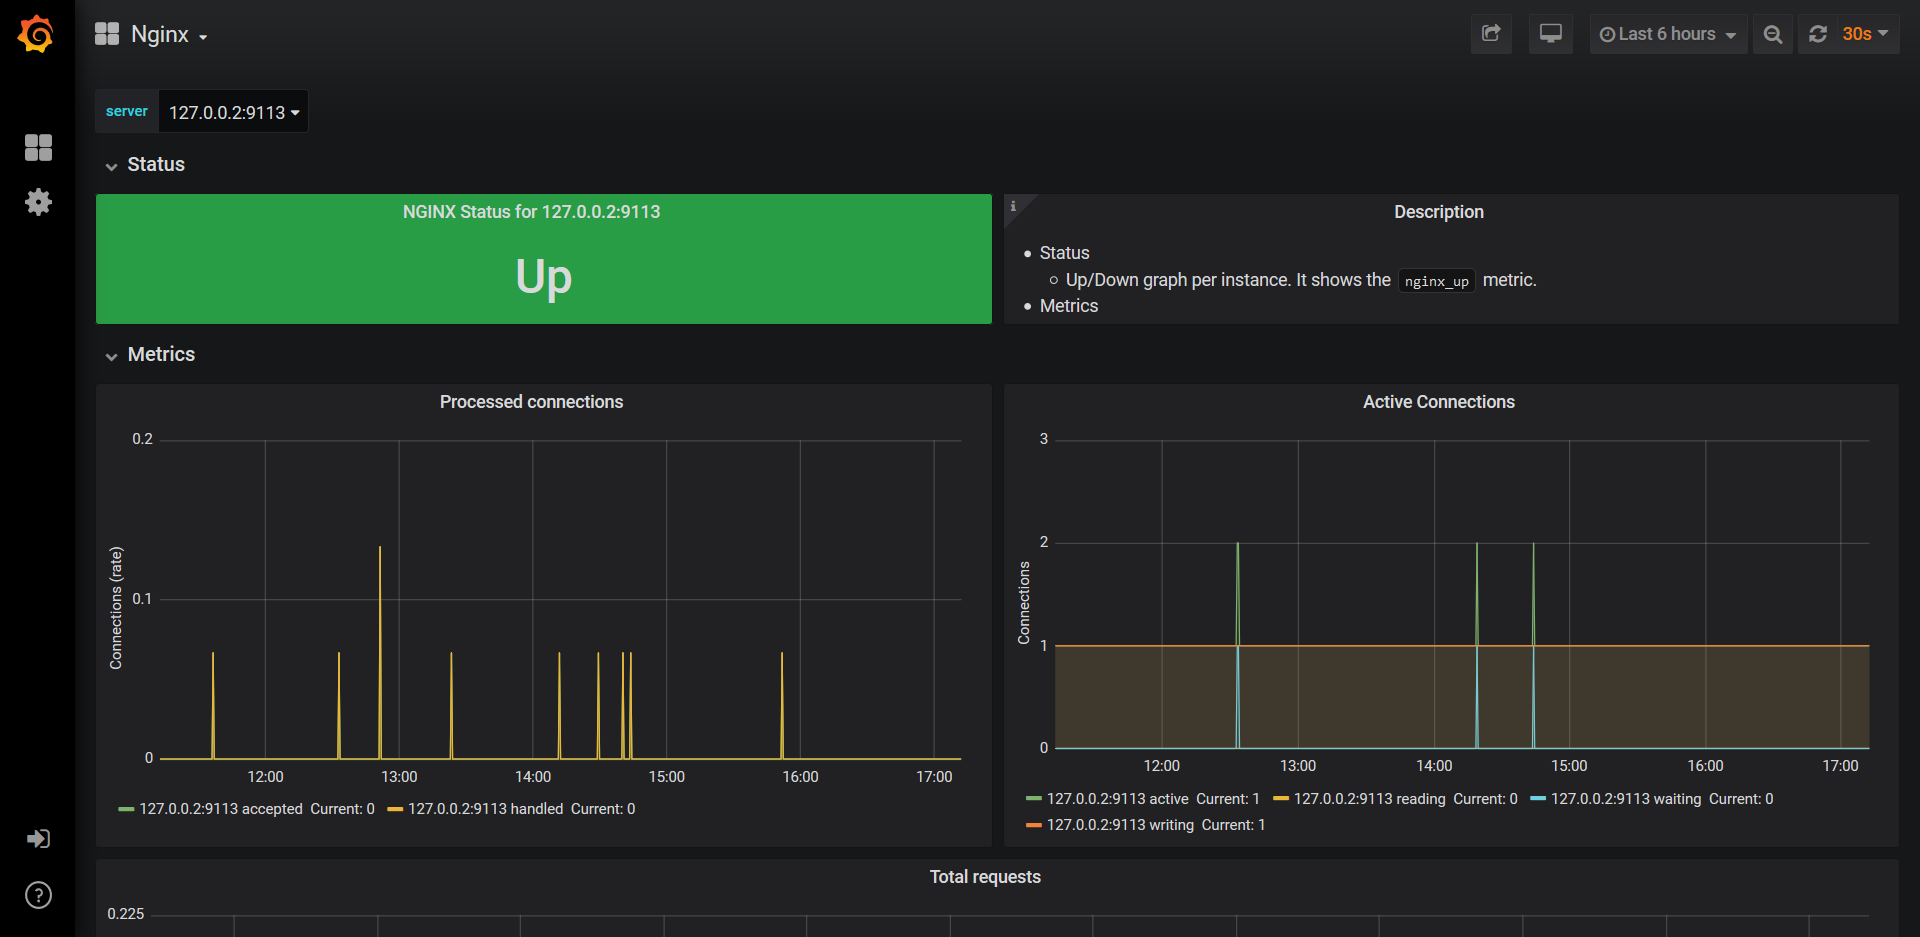
Open http://you_ip:3000 after the installation is completed. This is Grafana server. Grafana includes three dashboards: for HAProxy, for NGINX and for Node exporter. Don't forget to install HAProxy, NGINX and Node exporters on the servers to collect metrics from those machines.