How to install exporters
Exporters are add-ons designed to collect data from various services and applications, facilitating integration with tools for monitoring and real-time analytics. In Roxy-WI, you can easily install exporters to integrate with Prometheus, one of the most popular and most powerful monitoring tools available.
The following types of exporters are available:
- HAProxy Exporter;
- NGINX Exporter;
- Apache Exporter;
- Keepalived Exporter;
- Node Exporter (an exporter for collecting data on the operating system and hardware state).
HAProxy has supported a built-in Prometheus exporter since version 2.4.9. If you are using an older version, you will need to upgrade HAProxy.
Roxy-WI allows you to install Prometheus via the web interface. The built-in Prometheus exporters are available only if HAProxy is installed from the RPM repository via Roxy-WI. Otherwise, you will need to install an external exporter.
To install the exporters, go to the Installation => Monitoring section.
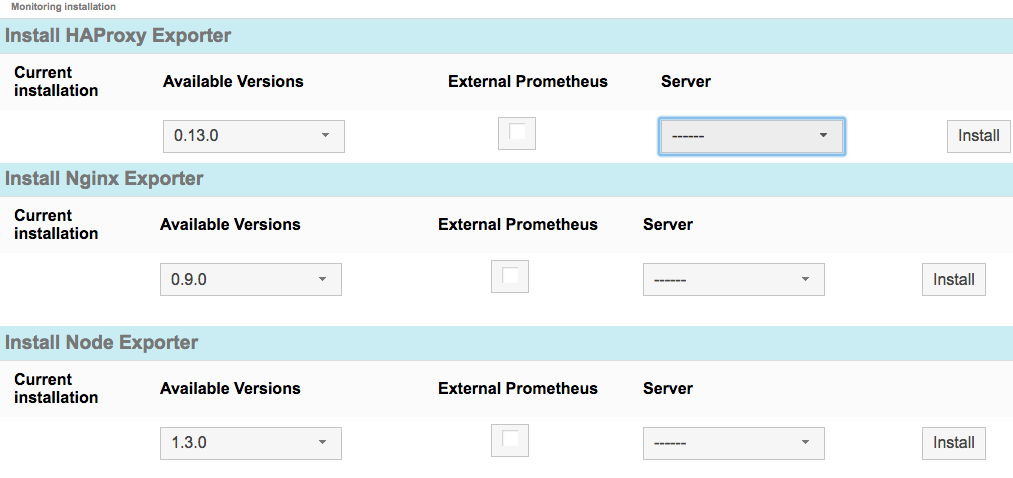
Select the version of the desired exporter and the server where the exporter will be installed, then click Install.
Once you have completed the installation ot the exporter, it is recommended to combine the Stats page and the Prometheus endpoint into a single frontend section. To achieve this, add the following lines to your HAProxy configuration file:
                            frontend stats
                            bind *:8404
                            option http-use-htx
                            http-request use-service prometheus-exporter if { path /metrics }
                            stats enable
                            stats uri /stats
                            stats refresh 10s
As you can see from the configuration file snippet mentioned above, we enable the Native HTTP representation (HTX) mode. The http-request use-service line instructs HAProxy to intercept requests for /metrics and direct them to the exporter. While you can choose a different path for the exporter, /metrics is the default path used by Prometheus. If everything is configured correctly, the list of metrics will be accessible at http://localhost:8085/metrics.