

How to work with the HAProxy Stats pages
The HAProxy Stats page is a powerful tool that provides you the following opportunities:
- Real-time monitoring — the HAProxy Stats page provides a near real-time feed of information that can be used to troubleshoot proxied services;
- Traffic insights — get detailed information about your traffic usage;
- Server load monitoring — monitor the load placed on your servers to ensure optimal performance;
- Frontend and backend management — manage your frontends and backends directly from the Stats page.
Open HAProxy => Stats, select a server and click Open. The selection and status filters are shown below. Statistics appear when the server's HAProxy stats endpoint is configured and reachable.

Roxy-WI provides a more convenient and user-friendly interface than the HAProxy Stats page, consolidating all information in one place. You can temporarily disable or enable backends servers, switch them to maintenance or ready mode, and filter the sections by status.
This option allows you to temporarily disable backend servers and switch them to maintenance mode.
To do this, select the servers and choose the action to perform from the drop-down menu, as shown in the picture below:
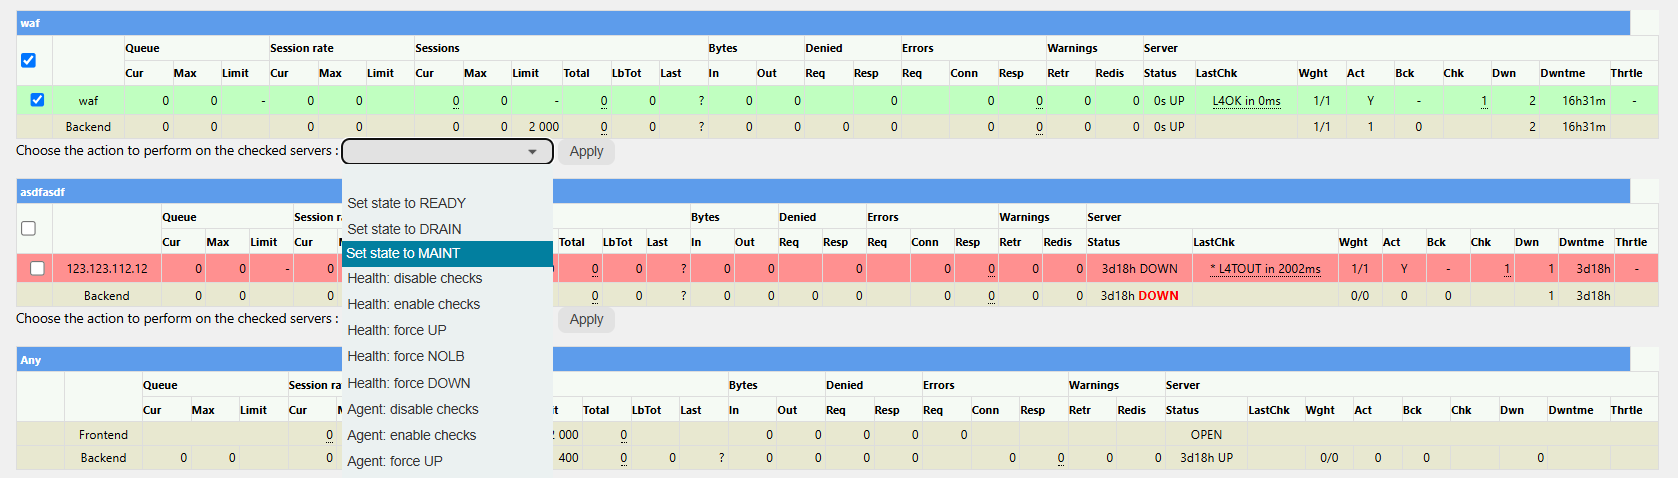
After this, click Apply and reload the page. You will see the following result:


To enable the server again, select it and choose the Set state to READY option. Then, click Apply and reload the page.
Additionally, Roxy-WI allows you to filter frontends and backends by status. If you do not want backends with servers in maintenance status to be displayed, simply uncheck the checkbox, in the filter bar, and those rows will be excluded from the output.